Understanding the Optical Emission Spectrometer (OES)
Types and importance of their detectors (CMOS, CCD and PMT)
1/24/20254 min read
What is a spectrometer?
From the outset, it's important to understand the term "spectrometer." A spectrometer is a device that separates and analyzes the individual spectral components of a physical phenomenon to produce analytical results of interest. Spectrum, although most naturally associated with light, could also be mass, magnetic, electron, etc., leading to a wide variety of spectrometry types, such as optical spectrometry, photoelectron spectrometry, mass spectrometry, and so on.
What is an optical emission spectrometer (OES)? Or what is an atomic emission spectrometer (AES)?
Optical spectrometry refers to the analysis of a spectrum of light separated by wavelength. It can be of two types: absorption or emission. An atomic optical/emission spectrometer (AES/OES) is one that analyzes the optical spectrum (light) emitted by an excited sample. Excitation can be achieved by various means, such as the application of a spark, plasma, flame, etc. That said, the term "OES" is now ubiquitously used to refer to the arc-spark OES technique.
What are the principles on which the arc/spark optical emission spectrometer works?
Arc/Spark OES works on two very basic principles of physics:
• Electrons in atoms absorb energy (become "excited") and move to higher-energy states (also called orbits) when energy is applied to them. When this energy source is removed, the electrons fall back to the ground state and release the absorbed energy in the form of photons.
• No two atoms of different elements can emit photons at the same wavelength. Therefore, each wavelength is unique to a single element.
This means that once we know the wavelength of the emitted photon, we know what element emits it!
How does an arc/spark OES work?
In an arc/spark OES, the principles described above are used to analyze metallic samples (generally, but we'll discuss this later) to assess exactly which elements are present and in what proportion. The result of the OES is a detailed assessment of the sample's elemental composition in weight percentages.
First, the sample must be "spark excited." Therefore, the sample is first prepared, i.e., one side of the sample is made absolutely smooth, clean, flat, and as free of surface defects as possible. Appropriate sample preparation methods must be used for this purpose. The prepared sample is then placed in the sample holder, as shown below. The sample holder has a hole that the sample must cover. Beneath this, an electrode is placed at a fixed distance from the exposed surface of the sample. This entire spark gap is filled with argon for analysis. A high current is then applied to the sample.
Extremely high levels of direct current create a plasma in the atmosphere of the argon-purged spark chamber, creating a rapid series of high-energy sparks between the electrode and the sample. The application of these sparks causes a portion of the sample to vaporize. The vaporized atoms in the plasma absorb energy, and their electrons transition to higher energy states with each spark. With each removal, the electrons return to the ground state and emit photons. Because so many elements emit photons simultaneously, a composite emission is generated. This composite light is then dropped onto a diffraction grating.
The diffraction grating separates each individual wavelength and creates a spectrum inside what is called the "optical chamber."
Now the spectrum can be clearly analyzed! The basis of the analysis is, of course, simplicity itself. We know the wavelengths that characterize each element. Furthermore, the greater the emission intensity at an element's wavelength, the higher its concentration. If we had a database containing the concentration levels corresponding to the different intensity values for each wavelength of interest to us, we could simply look up the emission intensity in this database and confidently state the concentration of the individual elements.
How the first spectrometers worked.
The earliest (very early) instruments had to work without photoemitters. Therefore, early researchers had to rely on more mundane analog methods! They simply placed a photographic plate on which the diffracted spectrum would fall. This plate was then developed and studied to arrive at the required results.
The first step towards automation: the introduction of PMT detectors.
However, in the 1930s, the photomultiplier tube (PMT) emerged—a vacuum tube that emits electrons when light falls on it. Spectrometers quickly shifted to using PMTs. A PMT was placed inside the optical chamber in a precise position for each wavelength the user wished to analyze. Alongside this, a computer was also connected to the spectrometer. The computer stored the database against which the PMT results were compared to arrive at the required elemental composition. This automated the process and not only made it much faster and more convenient, but also much more accurate and error-free.
This worked very well for decades, but, as always, technology advanced. PMTs clearly had many drawbacks:
Lack of flexibility: once purchased, that's it!
• There is no possibility of modifying it once it is done.
• Even the increase of a single element meant a new OES!
The cost and tedium remained very high.
• The detectors, cards, etc. were extremely expensive.
• Regular profiling, vacuum pumps, etc. are required.
The Revolution: The Death of PMT 's and the rise of CCD and then CMOS:
The introduction of CCD (charge-coupled device) and now CMOS (complementary metal-oxide semiconductor) detectors literally solved all the problems posed by PMT devices and also offered several additional advantages to spectrometer manufacturers and users. These include:
Unmatched flexibility
• Each wavelength is captured, so it can be analyzed.
• There is no space limitation since the CCDs are small.
Instruments became smaller and less expensive.
• The high-resolution grating and CCDs result in shorter focal lengths.
• Fewer detectors mean fewer cards and lower cost.
Low tedium and low running costs!
• There is no need to create profiles, etc., as this is all automated.
• No vacuum and efficient electronics = lower running costs.
Therefore, spectrometers rapidly evolved toward the use of these devices, and today, modern OES 's consist exclusively of optics with these devices.
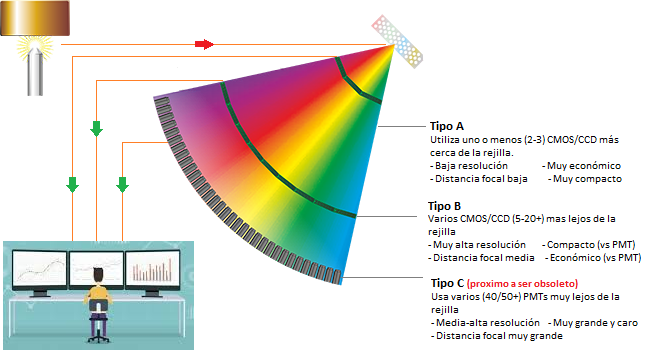
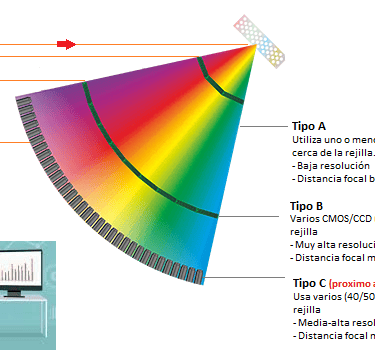
So what types of OES are available today?
While modern OES design focuses exclusively on CMOS/CCD detectors, there are still a few legacy instrument models on the market that still feature PMT detectors. Just as when the shift to DSLRs began, not all analog SLR 's were immediately retired, although the decline in PMT OES market share has been precipitous, there are still a handful of models with this technology remaining on the market. Therefore, for the most part, current OES can be classified into three types, as shown below. All told, PMT OES are now virtually obsolete and form a very small fraction of the overall market.